Tableau Report Generator: It's Quicker to Examine The Fields This Way.
in Blog
Streamlit: App | Code: Github | A collaborated work with Nguyen Dinh Thong
Simplifying the Complex: A Programmer’s Perspective
Tableau is a powerful tool for delivering business reports to end users. The quick prototyping capabilities and user-friendly interface are compelling selling points. That said, dashboards packed with heavy transformations that generate complex insights are challenging to maintain. This is particularly true for developers who rely more on the freedom of programming than on the GUI experience to create their products.
Disclaimer: I may not yet be at the highest efficiency level with Tableau, but it could also be that this is how it was intended to be designed.
Let me demonstrate my point. To understand what’s happening under the hood to create a certain (sophisticated) visualization, I need to go to the corresponding worksheet and inspect the relevant fields. Some fields are derived from existing ones, while others are second-order derivatives, and so on. I mentally note their relationships and “connect the dots” in a notebook on the side. That’s quite an effort, isn’t it?
If this were a code base, I wouldn’t feel these same constraints. So, here’s the Problem Statement: I need a navigation tool to unveil the computation logic of any Tableau visualization. This would enable me to document the logic more easily for maintenance purposes.
From Binary to Insight
One valuable clue we have: everything we need to know is stored within the Tableau workbook file (.TWBX). At first glance, this appears to be a binary file; however, experience has taught me that it could actually be a .zip file in disguise. Indeed, when you rename it with a .zip extension and decompress it, you’ll find a few artifacts: a .TWB file and folders for Data and Images. Field definitions and their dependencies are contained within the .TWB file, which is essentially just an .XML file. It’s logical to deduce that we need to write a parser to scan through this structure and extract the valuable information!
With this insight, we designed a Streamlit application with the following features:
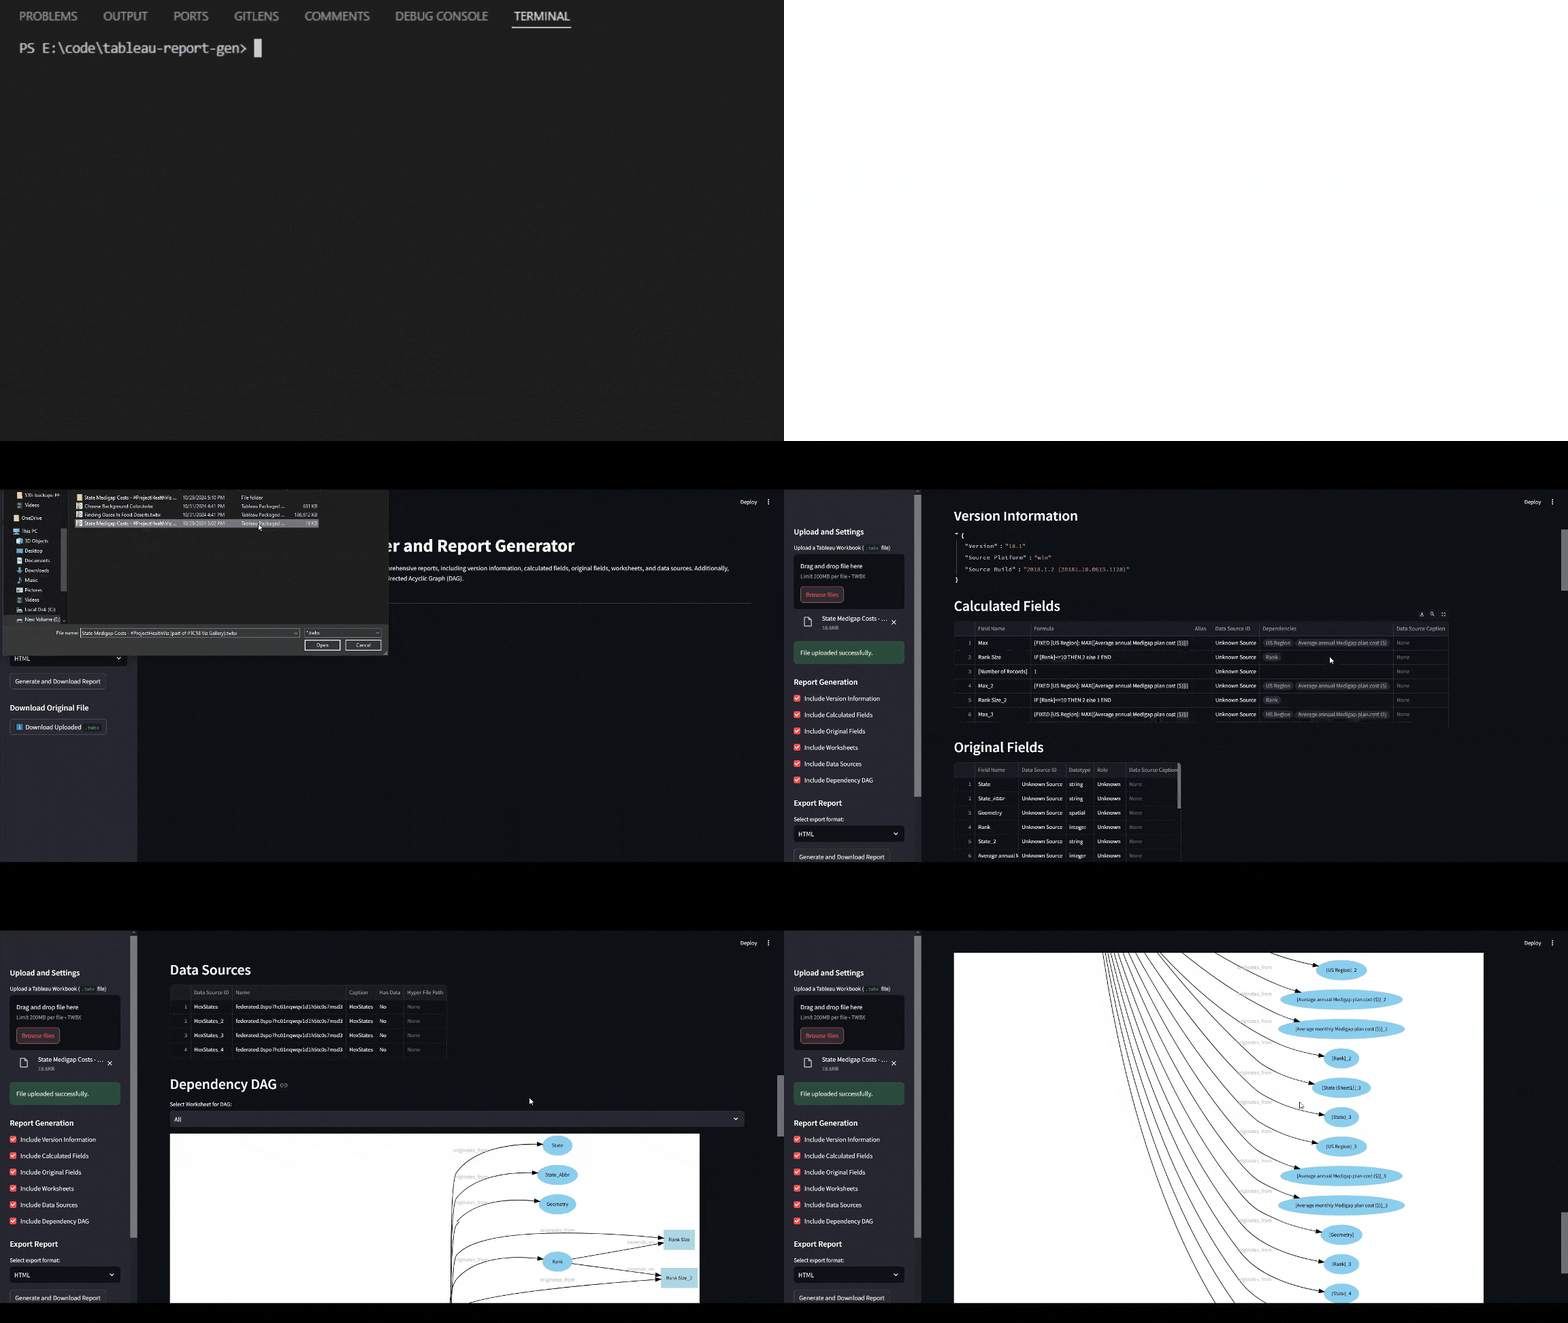
- Displaying the parsed original and derived calculated fields (along with their formulas and data sources).
- A DAG graph that captures field dependencies for all fields, with selective visualization.
- Exportable to HTML or PDF.
The app is publicly accessible and should not interact with the data in the workbook, only with its structural metadata. If you have data privacy concerns, we’ve also published the code as a package called tableau-report-gen, which supports Python 3.12 and higher. You can install it and run the app locally.
The App
Here’s a glimpse at how the app works:
 Fig. 1. Demonstration of tableau-report-gen app.
You can access the public website at the Streamlit App. We welcome contributions from the community on Github.